Supervised Learning: Regression
This is the 3rd in a series of class notes as I go through the Georgia Tech/Udacity Machine Learning course. The class textbook is Machine Learning by Tom Mitchell.
Regression & Function Approximation
We now turn our attention to continuous, instead of discrete variables. We use the word regression in the statistical sense of the word.

I will assume you know Linear Regression here (including all the linear algebra bits), but here's a pdf summary if you need to get caught up.
In general - you want to pick a good order polynomial for regression that fits your data, but doesn't overfit it in a way that doesn't generalize well. (eg an 8th order polynomial for a 9 point dataset)
Errors
Training data often has errors. Where do they come from?
- Sensor error
- Malicious/bad data
- Human error
- Unmodeled error
Errors cause noise, and regression helps us approximate functions without that noise.
Cross Validation
The goal is always to generalize. We need a good check for doing our regressions to be sure we are generalizing properly. We can't use the Test set because that is "cheating", so the solution is to split out yet another set of our data (from our training set) for the sole purpose of cross validation
Errors vs Polynomial
The usefulness of cross validation for guarding against overfitting is helpful here:
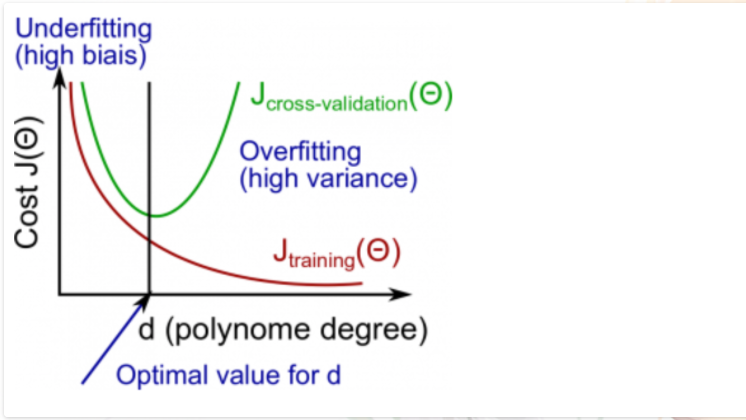
Initially both processes start out with moderate errors at low order polynomials. (The data is underfit). As this increases, the fit gets increasingly better. However past a certain point, polynomial continues to fit the training set better and better, but does worse on the CV set. this is where you know you have started to overfit.
Other Input Spaces
We've so far discussed scalar inputs with continuous outputs, but this same approach can be applied for vector inputs, that have more input features. If you want to sound pretentious, you can call it a hyperplane:
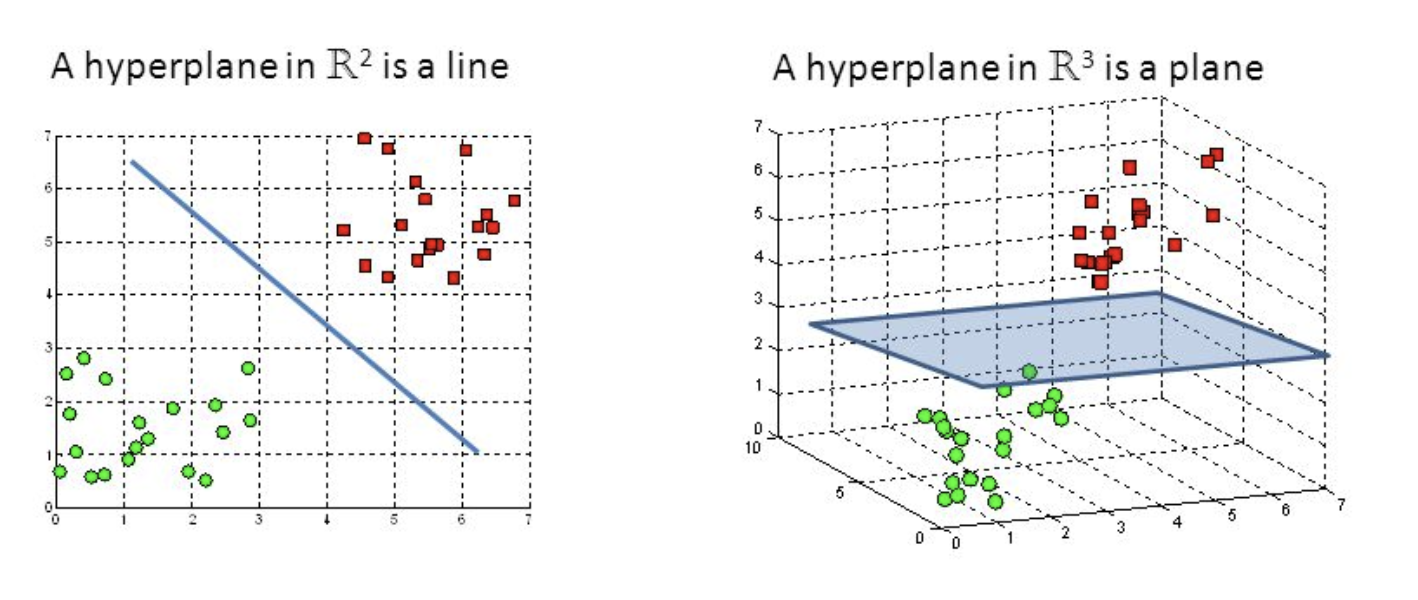
But really it is the multidimensional analogue of the 2 dimensional line chart.
You can encode discrete values as well into regressions, as scalar values, or as a vector of booleans.
Next in our series
Unfortunately, I'm a former Math major and didn't find much worth noting or explaining in this part of the series. If you need a proper primer on regression, see the linked resources above or seek out your own tutorials. I am planning more primers and would love your feedback and questions on:
- Overview
- Supervised Learning
- Unsupervised Learning
- Randomized Optimization
- Information Theory
- Clustering - week of Feb 25
- Feature Selection - week of Mar 4
- Feature Transformation - week of Mar 11
- Reinforcement Learning
- Markov Decision Processes - week of Mar 25
- "True" RL - week of Apr 1
- Game Theory - week of Apr 15